Sunday, September 30, 2007

Outlook for 1 Oct 2007


I have some difficulty showing you the R1 vaule on the chart. For STI R1 at 3720 & R2 at 3810.
And Dow R1 at 14041 & R2 at 14200.
Please look closely at the red & green arrows showing the volume in the charts. There is also a divergence of MACD histogram & DJI index.
( Refering to Dow Jones) This month of Sept we made a 4.03% gain, the last time that a month of Sept with this good performance is in 1998. I believe that the month of Oct we will have a correction. Only time will tell.

Wednesday, September 26, 2007

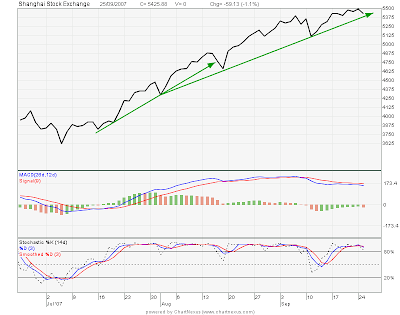
China Index near Support Line.

There is a divergence between stock index and MACD lines. Refer to the link below, sell volume are higher than buy volume.
http://www.sse.com.cn/sseportal/en_us/ps/md/sh_b_qck.jsp?code=000001.SS&cycle=1

Outlook for 26 Sept 2007


Looking at the trading Volumes, Sell volume are getting stronger. Do keep track of the trading volume in the next few days, a reverse may happen as we moving toward historical high. We need a strong buy volume to break these levels.

Sunday, September 23, 2007

Outlook for 25 Spet 07


Basically, we can see some buy strength in the markets. Therefore, current uptrend will continue but do watch out the for any weakness in buying strength compare to selling strength.
Do monitor for MACD red bars appearing.

Wednesday, September 19, 2007

The Aftermath of Fed Making 0.5% rate cut.

Last weekend, I was hoping that Fed don't make the cut, but Fed made a 0.5% cut.
In the coming weeks, we are likely to see two events happening.
1. Weak US Dollar
2. Inflation, ie. Crude Oil hitting US$90 or higher.
Although, a collapse of US was unlikely to happen but at least in the next few months a weak USD are bound to happen. Most Foreign Players buy in USD for 3 things, Properties( Long Term ), Bonds ( depend on the years they buy ) & Stocks ( Short Term ). You guess what will happen next/latter.
A common practise for Central Banks around the world, is to use Interest Rate to control Inflation Rate. Recently, we are seeing China's inflation problem spreading globally. With the rate decreases, Commodities will raise lead by Crude Oil.
IMO, what Fed had did was to solve a current problem. They are lending money to gamblers ask them not to gamble again...
I have added S2 into the chart.

Sunday, September 16, 2007

Outlook for 17 Sept 2007


From this week onwards, I have added MACD & Stochastic into my analysis charts. Last week, I thought that the markets will end the bull run as we await for US Fed's meeting on 18 Sept (this week). But that did not happen, market made a small correction and the bull started running up again.
As for the coming week, low volume expected on Monday & Tuesday, as Asia markets awaiting overnight announcement of Fed on 18 Sept. Currently, I believe that 90% traders believed that Fed will cut rate at least 0.25%, some even projected a 0.5% cuts. As for me, I belong to the 10% group, and after the anouncement, we should see a bit of retracement started.

I don't think that US will cut rate on 18 Sept because of inflation pressure, Crude oil hit record high & both Bs ( Bush and Bernanke ) have warned that they will not help people due to stock markets losses. In addition, the market have pre-dissolved the news that Fed will be cutting 0.25%. Even if Fed were to cut more than 0.25%, it tells the market that there is a problem in US. Therefore, market are likely to be weak this week.
Oh, one more thing, buy volume are in downtrend & selling volume are in uptrend ( refer to charts. )

Result of 10 Sept to 14 Sept


For the past week, STI did not even need to test S1 a strong bull trend was still intact.

Saturday, September 8, 2007

STI Outlook for 10 Sept 2007


This week's R1, N & S1 numbers.
Last night, US's Nonfarm Payroll M/M was -4k instead of 100k estimated. To make that worse, Alan Greenspan, Ex Fed Boss, said that current situation was similar to prior crash of 1987 & 1998.
Coming week, STI & DJI should be testing my S1 and if there's a need, I will post out S2 numbers in the charts. (Anyway, STI S2 is 3301 and DJI S2 is 12800 )

Result 3 Sept to 7 Sept


It's been a busy week for me, sorry cannot post anything in the mid-week. Just post up the pictures to show the usefulness of R1, N & S1. Sorry again, I can't show the formulae as it was belong to someone else...

Saturday, September 1, 2007

STI Outlook for 3 Sep 2007


As Bernanke & President Bush have promised to help sub-prime mortgages, more uptrend in the following week. Currently, almost everyone believed that Fed will drop interest rate on 19 Sep 07 Fed meeting. We will wait and see.
I have added R1, S1 & Neutral lines in the charts. These lines are base on some calculation on past week data. If Indices are near to R1 or S1 it will tend to move back to neutral if trading volume reduces.