 Currently, we are below the downtrend lines ( Grey ) in both charts. Holidays are around the corner so weaker volume ahead. 50, 100 & 200 MA look like joining together soon.
 Firstly, the DJI chart and this week S1, R1 & N lines. Tonight( Singapore Time ), Fed will make the announcement. Most people will hope for a 0.25% rate cut and stock market tomorrow will rally to new highs ( Just like what had happen 6 weeks ago ). Personally, I feel that even if Fed drop rate by 0.25%, I don't think market will rally again.
This week charts and S & R lines.

Will Update Dow Jone & Fed Meeting Outlook.

 I have some difficulty showing you the R1 vaule on the chart. For STI R1 at 3720 & R2 at 3810.
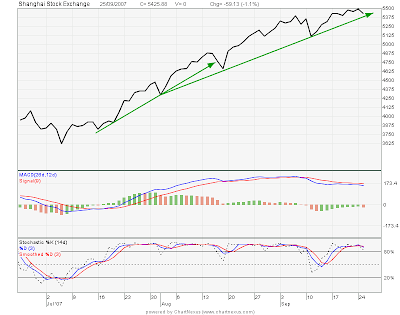
 There is a divergence between stock index and MACD lines. Refer to the link below, sell volume are higher than buy volume.
 Last weekend, I was hoping that Fed don't make the cut, but Fed made a 0.5% cut.
 From this week onwards, I have added MACD & Stochastic into my analysis charts. Last week, I thought that the markets will end the bull run as we await for US Fed's meeting on 18 Sept (this week). But that did not happen, market made a small correction and the bull started running up again.


 As Bernanke & President Bush have promised to help sub-prime mortgages, more uptrend in the following week. Currently, almost everyone believed that Fed will drop interest rate on 19 Sep 07 Fed meeting. We will wait and see.
 As in the chart, STI hits 200MA and rebounded strongly. With Dow & Nasdaq moving up strongly in overnight trading, STI will continue its uptrend on Thursday in early hours of trading.


 Thursday, a retracement happened in the late morning once STI was just slightly above 50 days MA.( read my Thursday post. ), This ended on Friday at 3318 (support), and ended the day at 3369.